четверг, 10 июля 2014 г.

Sporadic Ops Github Digest #5 (July 10th 2014)


"Did you missed me?" :)

Was quite busy. So, let's continue our fascinating journey to amazing world of interesting and/or useful (to the Ops engineers) Github projects!

1. A shell console with GUI features http://xiki.org
https://github.com/trogdoro/xiki

Did you see that awesomeness? If not - go to http://xiki.org and give it a try. It's definitely some fresh air for old and stale world of 70's unix shells.

Did you start own "awesome" list of something? Not yet?
Now we have bunch of them - Scala, Go, but my favorite is :

2. Awesome awesomeness - A curated list of awesome awesomeness.
https://github.com/bayandin/awesome-awesomeness


3. A Python library for automating interaction with websites.
https://github.com/hickford/MechanicalSoup

Same thing as Perl's WWW-Mechanize and Ruby's Mechanize - but compatible with python 2.x and 3.x and using Requests and BeautifulSoup as engine.

4. Snabb Switch: Fast open source packet processing
https://github.com/SnabbCo/snabbswitch

Very interesting project of open-source Lua-powered bare metal ethernet switch/router/firewall. Check that article for start - Snabb Switch - Skip The OS And Get 40 Million Requests Per Second In Lua

5. The next-generation email platform 
https://www.inboxapp.com/
https://github.com/inboxapp/inbox

Also very interesting project - Mail retrieval engine + API - you can collect email from various sources and retrieve it in your app/service - python-based and ready to run on your laptop or server.

6. 500 Lines or Less
https://github.com/aosabook/500lines

Not very interesting for now, but put it to your bookmarks or watch it on Github. New "The Architecture of Open Source Applications"-like book will be there soon.

7. Easily use tmux to collaborate with distant friends!
https://github.com/non/pairing

Small tool for pair programming over sharing your terminal with tmux.

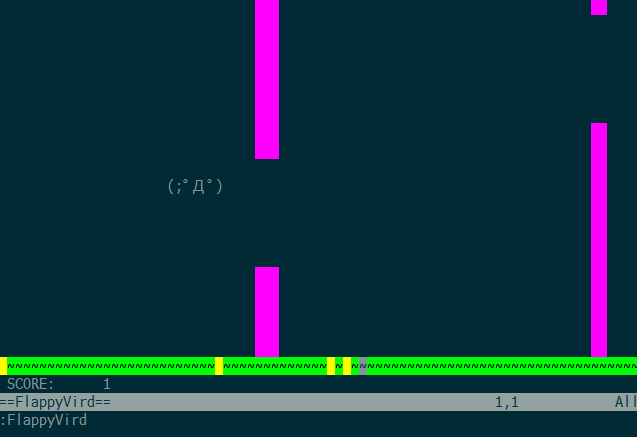
8. Flappybird clone for Vim
https://github.com/mattn/flappyvird-vim

Just for fun! Awesome stuff! :)
суббота, 5 июля 2014 г.

Sporadic Gihub Ops Digest #4 (July 5th 2014)

I'm continuing to collect interesting Github repos (for Ops people but other geeks too):

1. Awesome Ruby.
A collection of awesome Ruby libraries, tools, frameworks and software https://github.com/markets/awesome-ruby

We have a Amazing PHP, Python, Ruby and sysadmin repos. But where's Perl ?

2. Vex.
Run a command in the named virtualenv. https://github.com/sashahart/vex


3. Rainbow Stream.
Terminal-based Twitter Client. https://github.com/DTVD/rainbowstream


4. statsrelay
A consistent-hashing relay for statsd metrics https://github.com/uber/statsrelay

5. EulerPy
Python-based Project Euler command line tool.
http://iKevinY.github.io/EulerPy
https://github.com/iKevinY/EulerPy


6. ReplayLastGoal
Automatically create an animated gif with the latest goal at the world cup
https://github.com/xdamman/ReplayLastGoal

Just for fun!

среда, 2 июля 2014 г.

Sporadic Ops GitHub digest #3 (02 Jul 2014)

We are still rollin'. Go!

1. Tessera.
A dashboard front-end for graphite 
https://github.com/urbanairship/tessera
Good and promising Graphite dashboard.

2. BitAuth
Authenticate with web services utilizing the same strategy as Bitcoin.
https://github.com/bitpay/bitauth

Proposal for a new passwordless authentication protocol which is not storing user passwords at all. :)
See their blog for details.

3. cheap secrets
Store your passwords in git
https://github.com/bpo/cheap-secrets

Personal password storage in Git, nice. PGP encrypted, of course.

4. doitlive
doitlive is a tool for live presentations in the terminal. It reads a file of shell commands and replays the commands in a fake terminal session as you type random characters.
https://github.com/sloria/doitlive

If you need to do presentations of your terminal sessions.

5. Ambassadord - A Docker ambassador (containerized TCP reverse proxy / forwarder) that supports static forwards, DNS-based forwards (with SRV), Consul+Etcd based forwards, or forwards based on the connecting container's intended backend (read: magic).
https://github.com/progrium/ambassadord

Too much to explain. :) Read about Docker first.

вторник, 1 июля 2014 г.

Sporadic Ops GitHub digest #2 (01 Jul 2014)

Second issue of mine Sporadic Ops GitHub digest.

1. A curated list of awesome Python frameworks, libraries and resources. 
Inspired by awesome-php
https://github.com/vinta/awesome-python

Tons of useful stuff for pythonistas.

2. A well-written BSD licensed C language TLS implementation
https://github.com/wbl/SolidTLS

Another fork/rewrite of OpenSSL 'bloatware', good to know.

3. Simplistic interactive filtering tool
https://github.com/peco/peco

Cool little console tool, check screencasts for details.

4. Wrk - Modern HTTP benchmarking tool
https://github.com/wg/wrk

Lua-powered multi- thread / core HTTP benchmarking tool.

понедельник, 30 июня 2014 г.

Sporadic Ops GitHub digest #1 (30 Jun 2014)

For no specific reason I decided to put some interesting for Ops engineer (on my opinion) Github projects to periodical (I hope) but quite sporadic digest.

So, what we have for today, in no particular order:

1. UNIX command line client for Twitter written in Go 
Just toy for now, please contribute.

2. Terminal-based SoundCloud client. 
Without all these stupid CSS files. Runs on OSX and Linux https://github.com/grobie/soundcloud2000

3. An open-source graph database by Google 
https://github.com/google/cayley
Good competitor for Neo4J (maybe, someday, in future).

4. Securely and anonymously share a file of any size 
Tricky mix of Tor and python, I like that!

5. A drop-in, low-overhead monitoring web dashboard for a linux machine https://github.com/afaqurk/linux-dash 
Simple PHP-based dashboard for one server.

6. Ajenti - the web admin panel everyone wants. http://ajenti.org
https://github.com/Eugeny/ajenti 
Neat web admin panel, looks cool and modern!

7. Offline version of Project Euler 
8. A Python framework for creating interactive Twitter bots 

воскресенье, 27 апреля 2014 г.

PS: sysdig and chisels

A few more words about sysdig.
As I mentioned in my previous post, you can write scripts (using Lua) for sysdig called Chisels ( similar mechanisms are also present in SystemTap and Dtrace). But I forgot to mention that some of the chisels already comes bundled with sysdig. To view a list of chisels call run sysdig with -cl flag:


root@ubuntu:~# sysdig -cl

Category: CPU Usage
-------------------
topprocs_cpu    Top processes by CPU usage

Category: I/O
-------------
echo_fds        Print the data read and written by processes.
fdbytes_by      I/O bytes, aggregated by an arbitrary filter field
fdcount_by      FD count, aggregated by an arbitrary filter field
iobytes         Sum of I/O bytes on any type of FD
iobytes_file    Sum of file I/O bytes
stderr          Print stderr of processes
stdin           Print stdin of processes
stdout          Print stdout of processes
topfiles_bytes  Top files by R+W bytes
topfiles_time   Top files by time
topprocs_file   Top processes by R+W disk bytes

Category: Net
-------------
iobytes_net     Show total network I/O bytes
spy_ip          Show the data exchanged with the given IP address
spy_port        Show the data exchanged using the given IP port number
topconns        top network connections by total bytes
topports_server Top TCP/UDP server ports by R+W bytes
topprocs_net    Top processes by network I/O

Category: Performance
---------------------
bottlenecks     Slowest system calls
topscalls       Top system calls by number of calls
topscalls_time  Top system calls by time

Category: Security
------------------
spy_users       Display interactive user activity

Category: errors
----------------
topfiles_errors top files by number of errors
topprocs_errors top processes by number of errors

Use the -i flag to get detailed information about a specific chisel

To get help about some specific chisel - use -i flag.
root@ubuntu:~# sysdig -i topprocs_cpu

Category: CPU Usage
-------------------
topprocs_cpu    Top processes by CPU usage

Use the -i flag to get detailed information about a specific chisel

Given two filter fields, a key and a value, this chisel creat
es and renders to the screen a table.

Args:
(None)

You can run chisel scripts using -c flag:
root@ubuntu:~# sysdig -i topprocs_cpu

Category: CPU Usage
-------------------
topprocs_cpu    Top processes by CPU usage

Use the -i flag to get detailed information about a specific chisel

Given two filter fields, a key and a value, this chisel creat
es and renders to the screen a table.

Args:
(None)

Of course, you can combine chisels with filters:
root@ubuntu:~# sysdig -A -c echo_fds proc.name=sshd
------ Write 4.05KB to 192.168.152.1:7588->192.168.152.133:22

i>g}q
x Ayl
(g'`.{@Hp?;4VSFV|1=O?
m?1S
R [L^xzcX~ aqn*5o+#e |>KemR'4a\";,?$UgLco
K7bip8lANHLIC2M,6<[u\"Qp-2%rFEVZI?aD?}1\"x%9L}}CVLe]>o?\":QY%%q
K/MVpy^BTT/WR[]d`)^ '$Td2p63;x2;T3:n,%iOLFDP4>V SM!vK[Rcs$|pk]xKn[!e{4mft%)J:lH]W[
d]2}B!@zS?q\"YgljYYyR~8|u^

Also you can check out very intresting article in sysdig blog - Using sysdig to explore I/O with the “fdbytes_by” chisel
For example - you can get top file activitity by directories very easilly:
root@ubuntu:~# sysdig -c fdbytes_by fd.directory "fd.type=file"
Bytes     fd.directory
------------------------------
Bytes     fd.directory
------------------------------
1.14KB    /var/log/
76B       /dev/
Bytes     fd.directory
------------------------------
104B      /dev/
Bytes     fd.directory
------------------------------
83B       /dev/
Bytes     fd.directory
------------------------------
83B       /dev/


воскресенье, 6 апреля 2014 г.

Sysdig - new Linux tracing tool for sysadmins

Last week Draios company made bold move - they made their Linux tracing tool Sysdig open-source.
What is Sysdig? As it says on own website - "strace + tcpdump + lsof + awesome sauce".
And I think that tool is really quite awesome.
Installation for daredevils is quite simple -
curl -s https://s3.amazonaws.com/download.draios.com/stable/install-sysdig | sudo bash
But for more responsible sysadmins there's good manual - set up sysdig repo and install it (you'll need linux headers and DKMS for automatic kernel module build and installation).
You can start learning sysdig using this simple examples:
  • See the top processes in terms of network bandwidth usage:
  • sysdig -c topprocs_net
  • See the top local server ports (in terms of total bytes)
  • sysdig -c fdbytes_by fd.sport
  • See the top client IPs (in terms of established connections)
  • sysdig -c fdcount_by fd.cip "evt.type=accept"
  • Топ процессов по использованию диска
  • sysdig -c topprocs_file
  • Print the top files that apache has been reading from or writing to
  • sysdig -c topfiles_bytes proc.name=httpd
  • List the processes that are using a high number of files
  • sysdig -c fdcount_by proc.name "fd.type=file"
  • See the files where most time has been spent
  • sysdig -c topfiles_time
  • See queries made via apache to an external MySQL server happening in real time
  • sysdig -A -c echo_fds fd.sip=192.168.30.5 and proc.name=apache2 and evt.buffer contains SELECT
You can also record all events server-wide (or process-wide, or using other sysdig filter):
sysdig -w out.scap proc.name=httpd
and analyze that later, using even MAC or Windows workstation.
Also there is a framework for Lua - Chisel - you can write a simple script and execute them immediately at sysdig run.
However, there's an open question still - how much additional load sysdig brings to server.
Let's make a simple test. I have an small virtual machine on Ubuntu 12.04, 1 GB of RAM, with Percona Mysql 5.6 installed.
  1. Install sysbench:
  2. sudo apt-get install sysbench
  3. Create empty database 'sbtest' and fill it with test data:
  4. sysbench --test=oltp --mysql-table-engine=innodb --oltp-table-size=10000 --mysql-user=root --mysql-password=root --db-driver=mysql --test=oltp prepare
    
  5. Run sysbench
  6. root@ubuntu:~# sysbench --num-threads=8 --max-requests=5000 --oltp-table-size=10000 --mysql-user=root --mysql-password=root --db-driver=mysql --test=oltp run
    
  7. Results
  8. sysbench 0.4.12:  multi-threaded system evaluation benchmark
    
    Running the test with following options:
    Number of threads: 8
    
    Doing OLTP test.
    Running mixed OLTP test
    Using Special distribution (12 iterations,  1 pct of values are returned in 75 pct cases)
    Using "BEGIN" for starting transactions
    Using auto_inc on the id column
    Maximum number of requests for OLTP test is limited to 5000
    Threads started!
    Done.
    
    OLTP test statistics:
        queries performed:
            read:                            70014
            write:                           25003
            other:                           10001
            total:                           105018
        transactions:                        5000   (123.58 per sec.)
        deadlocks:                           1      (0.02 per sec.)
        read/write requests:                 95017  (2348.49 per sec.)
        other operations:                    10001  (247.19 per sec.)
    
    Test execution summary:
        total time:                          40.4587s
        total number of events:              5000
        total time taken by event execution: 323.5886
        per-request statistics:
             min:                                  5.83ms
             avg:                                 64.72ms
             max:                               8020.75ms
             approx.  95 percentile:             168.71ms
    
    Threads fairness:
        events (avg/stddev):           625.0000/24.51
        execution time (avg/stddev):   40.4486/0.01
    
Delete sbtest database, reboot virtual machine, repeat p.1 and 2
  1. Run sysdig in separate terminal:
  2. root@ubuntu:~# sysdig -w /root/mysqld.scap proc.name=mysqld
  3. Re-run test
  4. root@ubuntu:~# sysbench --num-threads=8 --max-requests=5000 --oltp-table-size=10000 --mysql-user=root --mysql-password=root --db-driver=mysql --test=oltp run
    
  5. Results
  6. sysbench 0.4.12:  multi-threaded system evaluation benchmark
    
    Running the test with following options:
    Number of threads: 8
    
    Doing OLTP test.
    Running mixed OLTP test
    Using Special distribution (12 iterations,  1 pct of values are returned in 75 pct cases)
    Using "BEGIN" for starting transactions
    Using auto_inc on the id column
    Maximum number of requests for OLTP test is limited to 5000
    Threads started!
    Done.
    
    OLTP test statistics:
        queries performed:
            read:                            70014
            write:                           25002
            other:                           10001
            total:                           105017
        transactions:                        5000   (71.62 per sec.)
        deadlocks:                           1      (0.01 per sec.)
        read/write requests:                 95016  (1360.97 per sec.)
        other operations:                    10001  (143.25 per sec.)
    
    Test execution summary:
        total time:                          69.8150s
        total number of events:              5000
        total time taken by event execution: 558.1830
        per-request statistics:
             min:                                  9.35ms
             avg:                                111.64ms
             max:                               1590.65ms
             approx.  95 percentile:             304.89ms
    
    Threads fairness:
        events (avg/stddev):           625.0000/39.17
        execution time (avg/stddev):   69.7729/0.02
    
    
So, average query time has almost doubled - 111 ms instead of 65 ms. Not very impressive. Truthfully speaking, test was quite artificial and not very methodologically correct though....