Показаны сообщения с ярлыком graphite. Показать все сообщения

воскресенье, 27 января 2019 г.

The current state of Graphite and its ecosystem

I opened the issue on Graphite project to discuss the future of Graphite project and found out that (my obviously opinionated) review for current ecosystem state is quite big, so I decided to put it separately - below.

The current state of Graphite and its ecosystem
1. Original Graphite https://graphiteapp.org
Language: Python
Storage: Whisper (Python)
Clustering capabilities: medium
Plus points:
* Current implementation standard.
* Still widely deployed, packaged by many distributions.
* Still working great for small to medium installations.
* Graphite-web is still a most full implementation of Graphite render protocol, most of the 3rd party storage implementations still using it as for render engine.
Minus points:
* Whisper storage: No compression, 12 bytes per point, very IO intensive
* Python: vertically scalable only by spawning more instances, which making scaling of relay and carbon components quite hard.
* Current clustering protocol of graphite-web is much better than in 0.9.x Graphite but still not working very well for big and/or volatile clusters.

2. Go-Graphite stack https://github.com/go-graphite/
Go-graphite is an effort to consolidate Golang re-implementations of different Graphite components, which were developed by Booking.com and other companies.
Language: Go / C
Storage: Whisper (Go)
Clustering capabilities: strong
Plus points:
* Go producing single binary per component, easily deployable and vertically  scalable
* New clustering protocol ("carbonserver") working much better in big clusters (Booking.com probably have biggest Graphite cluster in the world, based on that setup)
Minus points:
* Scattered components and development.
The project has no Golang-implemented relay yet, users should use 3rd party relays, e.g. carbon-c-relay or carbon-relay-ng.
The project has no storage component and using lomik's go-carbon, which currently have "carbonserver" built-in.
Carbonapi (graphite-web reimplementation) is not fully compatible with graphite-web and also currently forked in 2 separate forks - community fork and Booking.com fork.

3. Clickhouse stack
Clickhouse is an open-source analytic database, currently, open-sourced by Yandex. During internal development, it was used as Graphite storage, so it has some good implementation of Graphite parts inside (like aggregation). Yandex also open-sourced internal Java-based implementation of Graphite-compatible render part, named "Graphouse", but currently lomik's Golang reimplementation of components - carbon-clickhouse and graphite-clickhouse are much more popular. Please note, that this project contains no rendering components and will use Graphite-web or carbonapi for actual rendering.
Language: Go
Storage: Clickhouse (C++)
Clustering capabilities: strong
Plus points:
* Very good storage: low IO requirements, good compression (2-4 bytes per points typically)
* Can be used in small, medium and large installations - storage is scalable (despite lack of re-sharding, so, a bit like moving whisper files when extending cluster), other components are stateless go binaries
Minus points:
* Depends on Clickhouse's Graphite support - that's not the main purpose of Clickhouse, so, it theoretically can be removed or not-developed in future versions (but currently it's still there)
* User need to experiment with different storage schemas
* Extending big Clickhouse cluster currently can be painful (well, less painful then whisper, probably, I just mean can be not as smooth as e.g. Cassandra cluster).

"Yuuge" (Trump-voice) projects
We have currently 2 projects which were initially developed targeting big and very big Graphite installations - "Metrictank" and "Biggraphite"

4. Metrictank https://github.com/grafana/metrictank
Developed by Grafana Labs for supporting Grafana Cloud and WorldPing projects. A multitenant project aimed for big installations. I'm currently implemented MT cluster in my job, so, I'll describe it in a separate article.
Language: Go
Storage: Cassandra (Java) / BigTable (Google-cloud)
Clustering capabilities: strong
Plus points:
* Designed for scalability - all components are scalable, using Kafka as a bus for metric transport and clustering, using SWIM cluster for cache nodes
* Using strong caching layer for off-loading permanent storage, storing N hours of data in RAM cache for compression/deduplication.
* Re-implement some render functions in Golang, with proper fallback to Graphite-web
* Designed to run in containers (e.g. in Kubernetes)
* Good compression ratio for storage (also around 2-4 bpp)
Minus points:
* Cache nodes are quite RAM hungry and can go OOM (which require big overhead), especially during cluster start. Cache storage quite ineffective (comparable to storage) - 20-30 bytes per point (which is quite logical, the cache should be fast and not compact)
* Quite a complex system, you need to experiment with different deploy/setup strategies (well, that's probably true for every big and loaded storage)
* Not really useful in small installations (better to pick go-carbon or Clickhouse stack)

5. Biggraphite https://github.com/criteo/biggraphite
Designed by Criteo for own Graphite installation. Using Cassandra for extending storage, but reusing other components of Python stack.
Language: Python
Storage: Cassandra (Java) / Elasticsearch (Java)
Clustering capabilities: strong
Plus points:
* Scalable solution (you still need to scale python carbon instances, though)
Minus points:
* Big storage overhead (16-24 bytes per point)
* Not really useful in small installations (better to pick go-carbon or Clickhouse stack)

So, how I mentioned many times before, IMO Graphite is not only a project currently, but more like the whole ecosystem of projects, developed at a different time by different developers for different purposes. Not all of these projects are compatible with all features of the original project, but a user can (and should) pick up that or another implementation considering own use case, requirements, and implementation.

I'm planning to make separate writing about Metrictank and Clickhouse stacks soon.

воскресенье, 28 января 2018 г.

ASAP smoothing in Graphite

Good news, everyone!
In Graphite 1.1 we have custom (user defined) functions support. But how it works and what you can do with that? I can show you.

If you're watching for monitoring landscape state, you probably know about Monitorama conference. And if you watched Monitorama PDX 2017 talks you probably remember this talk from Kexin Rong, named "Automating Dashboard Displays with ASAP".
But if not you can watch her talk below:
Monitorama PDX 2017 - Kexin Rong from Monitorama on Vimeo.
and that's a slide:
https://speakerdeck.com/futuredata/automating-dashboard-displays-with-asap

You can watch it, it's 30 minutes and quite interesting - but in short she describing new time series smoothing algorithm, named "ASAP", which smooth data as smooth as possible, but not too much.
Right after this talk Wyndham "Bo" Blanton implemented ASAP as graphite-api custom function, also using Kexin's original code.

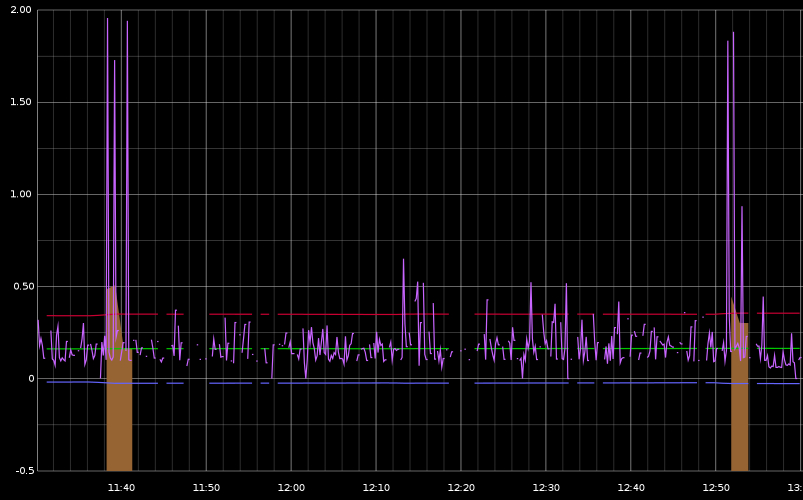
That's how it works in practice (click for bigger picure):

That was great, but original ASAP code using "numpy" library, which is a great thing, but sometimes is too heavy to include it in your product, and original Graphite had no support for custom functions (contrary to graphite-api).
But nowadays we have it, so, I adapted Bo's code a bit, you can check it using this link - https://github.com/deniszh/graphite_asap

This requires Graphite-web version 1.1.1 or newer and installed "numpy". For installation just copy asap.py and  functions.py files to /opt/graphite/webapp/graphite/functions/custom  directory and restart Graphite-web. Check output of  "http:///functions?pretty=1" - function "asap()'' should be present in the output. 
Check Graphite's Function Plugin documentation for details.


суббота, 21 февраля 2015 г.

Introducing collectd-iostat-python


Collectd-iostat-python is an iostat plugin for collectd that allows you to graph Linux iostat metrics in Graphite or other output formats that are supported by collectd.
This plugin (and mostly this README) is rewrite of kieran's collectd-iostat in Python and collectd-python instead of Ruby and collectd-exec

Why ?

Disk performance is quite crucial for most of modern server applications, especially databases. E.g. MySQL - check out this slides from Percona Live conference.
Although collectd provides disk statistics out of the box, graphing the metrics as shown by iostat was found to be more useful and graphic, because iostat reports usage of block devices, partitions, multipath devices and LVM volumes.
Also this plugin was rewritten in Python, because its a preferable language for siteops' tools on my current job, and choice of using collectd-python instead of collectd-exec was made for performance and stability reasons.

How ?

Collectd-iostat-python functions by calling iostat with some predefined intervals and push that data to collectd using collectd-python plugin.
Collectd can be then configured to write the collected data into many output formats that are supported by it's write plugins, such as graphite, which was the primary use case for this plugin.

Setup

Deploy the collectd python plugin into a suitable plugin directory for your collectd instance.
Configure collectd's python plugin to execute the iostat plugin using a stanza similar to the following:

Once functioning, the iostat data should then be visible via your various output plugins.
In the case of Graphite, collectd should be writing data to graphite in thehostname_domain_tld.collectd_iostat_python.DEVICE.column-name style namespaces. Symbols like '/','-' and '%' in metric names (but not in device names) automatically replacing by underscores (i.e. '_')
Please note that plugin will take only last line of iostat output, so big Count numbers also have no sense, but Count needs to be more than 1 to get actual and not historical data. And please make Interval * Count << Collectd.INTERVAL (20 seconds by default). I found e.g. Count=2 and Interval=2 works quite well for me.

Technical notes

For parsing iostat output I'm using jakamkon's python-iostat python module, but as internal part of script instead of separate module because of couple of fixes - using Kbytes instead of blocks, adding -N to iostat for LVM endpoint resolving, migration to subprocess module as replacement of deprecated popen3, objectification etc.

TODO

Maybe some data aggregation needed, e.g. we can use some max / avg aggregation of data across intervals instead of picking last line of iostat output.

вторник, 9 декабря 2014 г.

Semi-irregular Sysadmin Ninja's Github Digest (Vol. 17)

1. reptyr
Reparent a running program to a new terminal
https://github.com/nelhage/reptyr

Quite old tool made by @nelhage, it seems he is actively developing it again. It is really changes terminal for process.  "'reptyr PID' will grab the process with id PID and attach it to your current terminal. After attaching, the process will take input from and write output to the new terminal, including ^C and ^Z."
It is also quite interesting to know how it works - check this blog post if you are curious.

2. dockerana
Docker + Graphite + Graphana = Dockerana
https://github.com/dockerana/dockerana
It's exactly what it looks - Graphite + Graphana  packed in Docker container. Quite convenient.

3. seagull
Friendly Web UI to monitor docker daemon http://96.126.127.93:10086
https://github.com/tobegit3hub/seagull
Seagull is the best friend of docker which provides Web UI to monitor docker daemon. Demo site is down but screenshots looks nice. It seems that demo is working now.

4. Algorithms
Data Structures and Algorithms in Python
https://github.com/prakhar1989/Algorithms
Not very exciting stuff, but might be useful. Just as it says, it is collection of data structures and algorithms in Python.

5. pg_shard
PostgreSQL extension to scale out real-time reads and writes http://citusdata.com/docs/pg-shard
https://github.com/citusdata/pg_shard
Sharding helper extension for PostgreSQL. Nuff said, check docs.

6. peru
Maybe sometimes better than copy-paste.
https://github.com/buildinspace/peru
Ah, nice tool. Another approach of eternal problems of dependencies on your repos. Like "git submodules" but easier. Works with Mercurial and SVN too, not only with git. Demo gif below:

7. awesome-public-datasets
A awesome list of (large-scale) public datasets on the Internet. (On-going collection)
https://github.com/caesar0301/awesome-public-datasets
List of many public (but sometimes not free) datasets on Internet, for your fun and big data projects.

8. rocket
App Container runtime
https://github.com/coreos/rocket
CoreOS creates own container instead of Docker. Quite controversial decision, check their blog for explanation.

9. instavpn
the most user-friendly L2TP/IPsec VPN server
https://github.com/sockeye44/instavpn
Very user-friendly simple but secure VPN. Ubuntu, 512 MB RAM, curl -sS https://sockeye.cc/instavpn.sh | sudo bash, browse at http://IP-ADDRESS:8080 or use cli to setup.

10. shapeme
Evolve images using simulated annealinghttps://github.com/antirez/shapeme
Small toy from @antirez - it takes PNG and try to evolve bunch of triangles to copy it. Just for fun.

воскресенье, 7 декабря 2014 г.

A presentation on building a replacement for Graphite with Riemann, InfluxDB and Grafana

Quite controversial presentation IMO:


Yep, Clojure is cool, JVM has threads, it's nice, InfluxDB rules - but why we need Rieman then?
We can use cyanite - then we got Clojure, JVM and Cassandra for storage or graphite-influxdb - then we got InfluxDB and who cares about threads and Python GIL then?
Maybe Logstash / Heka integration is cool idea but you can do it with Graphite too...

Graphite scaling and my evaluation of Zipper Graphite stack

Hello!
Many Dev/Ops teams out there are using Graphite – nice tool for collecting and graphing various metrics from your software and/or hardware. It is a really nice tool and a good example of good architecture – you can check out Graphite chapter from famous AOSA book.
But it's also not a big secret that despite Graphite is great tool its scaling is really not an easy task. Until you run it on single server – everything is fine, you can easily spread it over a couple of servers but above that…
·      Problem one. If you are using (default and single production ready) whisper storage, then the single option of clustering is to use normal Graphite cluster mechanism. But then, after adding or removing some nodes from cluster you need to rebalance it, using e.g. carbonate tool. It’s fine but for loaded cluster with hundreds of thousands metrics and tenths servers, it could take not hours - but days and weeks - and during rebalancing Graphite cluster will producing very funny results.
·      Problem two. Current Graphite clustering based on HTTP requests (remote nodes asks each other using same Graphite-web engine) and current code is quite non-optimal, especially for aggregating functions across many nodes. Fixing that is in progress, we already have @bmhatfield's patch in 0.9.x branch (also with not merged yet parallelization improvement), another approach from @jraby which was transformed to patched graphite-web from @datacratic.
·      The third problem is relay / aggregator performance problems. Graphite relays and aggregators are CPU-bound (contrary to carbon-caches, which are IO-bound) and because of python's GIL single process can't use more that one core for CPU-intensive calculations. Then you need to create some loadbalancer-based configurations with many relay processes, which doesn't make things less complex, believe me.

So, if you faced with Graphite scaling problems you have next options:

1. Migrate to OpenTSDB.
Unfortunately, it will require quite big efforts, if you have your Graphite installation up and running for a while, and have many tools and dashboards around it. Also, scaling Hbase is a the little bit harder than throwing more servers into the pool...

2. Migrate to new storage engines.
I'll explain this way little bit.  Which alternative options do we have for now?
a)    @pyr's cyanite
Quite mature, has some production instances running. Uses Cassandra as storage looks like the natural choice for Graphite data because of high write-load tolerance.
I made an evaluation of it and found out that for our metrics it'll require 4x more space for data storage. For us it was "no-go" then, also I was suspecting that its scalability was not so great then (it was year ago, now it's much better)
InfluxDB looks also like quite a natural choice for storage - it's native time series database, with built-in sharding and clustering. Dieter Plaetinck wrote this for Vimeo and run it there in production.
In my tests InfluxDB look much better as storage - it took almost exact same space as whisper, but - only for one month. It's because of InfluxDB still has no retentions with aggregations (current InfluxDB's retentions just purge old data without any aggregation) - so, if you need to make queries across big timespan (e.g. year) you need or store all data with high precision (and wasting space) or make some aggregation by own - but of course, it will hit performance quite bad. Theoretically, you can use continuous queries for aggregation on InfluxDB level, but its support not integrated to graphite-influxdb.
And according to @dieterbe he's running graphite-influx on a single node, for now, so, I also suspect that scaling it across many nodes could be quite an adventurous journey too.
c)    ceres. Looks like abandoned for now.  I know that @dkulikovskiy made some changes in his own repo, including new roll-up mechanism – and Yandex running that on quite a big scale - but anyway, it doesn't look like a right path to go.

So, we still stick up with whisper, so, no solution for problem one yet for us, but if you only start running your Graphite – maybe it’s a good idea to run some new storage in parallel – especially if you already have some Cassandra or InfluxDB in production.
What next? What is about other problems?

We also faced relay scaling problems quite fast, and after struggling with that little bit we adopted Scala-based @markchadwick's graphite-relay – I just make it work correctly with graphite hashing. We lived about a year on that but after it starts to consume too much CPU too.
In that time, my boss @vlazarenko point me on this video from Linux.conf.au 2014 – it’s only 20 minutes and worth watching. I found out from it that Booking.com uses Graphite, and uses it under quite a big load. In this video, Devdas Bhagat also mentioned that after struggling with relay scalability they developed (and what is much better – open-sourced) new and shiny C-based graphite relay, named carbon-c-relay. (Edit: first I mistakenly named it  graphite-c-relay, d-oh... real name is and always was carbon-c-relay). We started using it instantly and from that time and up to now it works very well.
Its main contributor, Fabian Groffen, also implemented aggregation and regexes in a couple of last months, so, for now, carbon-c-relay looks like complete and pretty sane alternative for python-based relay/aggregation daemons. I can find only one downside – its output is still line-based and not-pickle based but that’s completely OK for us. Edit: As @grobian mentioned (and I completely agreed with that) pickle is insecure and bloated - line protocol is better for that case.

So, third problem is solved for now.
But I was really wandered how Booking.com struggling with second scaling problem, and after following @grobian on GitHub I found out how. It seems that they rewrite most of the parts of Graphite stack in Go! And results of it's quite impressive – they’re running about 90 backend servers with more than 55TB of whisper files!
And it looks like this project implemented by only two persons - Damian “@dgryski” Gryski and @grobian. I contacted Damian, asked a couple of questions and checked how their solution works. He also said that he and @grobian will make a blog post about their stack, but they still didn't - so, I'll try to do so. J

So, how normal Graphite cluster stack looks like? I'll take part of Jamie picture to illustrate:

Did you see that 3 graphite-web servers below? They’re communicating between each over (or a single frontend to all backends), so just imagine what happens if you have 10-20-30... backend servers instead of two - and you can imagine that speed of rendering will be very low then.
Then check out Booking.com solution (they need some cool name for it, I will call it zipper-stack for brevity). Please also bear with my non-existing painting skills:


See? Graphite-web talking to the single daemon, named carbonzipper. It talks to all backends, but not over plain text based “pickle-over-HTTP” protocol, but over new “protobuf-over-HTTP” protocol - so, on backends we have a separate daemon for speaking that, named carbonserver. Also, they have special carbonapi daemon - it talks to zipper daemon also but it has some subset of Graphite functions re-implemented in Go, so, his speed is blazing fast - you can switch all your monitoring metrics (which rendering as text and not PNG) there. 
So, looks good - let's deploy it.
As we are doing only evaluation we made it quick-and-dirty – just compile binaries and run it on a server, but for production you’ll need some packaging and configuration, of course. Also, it’s not a manual for Graphite installation – I assume that you have working Graphite cluster already and just want to check how-zipper stack works.
Initial build is easy - go to your build VM, install and set up Go there and run
root@vagrant-ubuntu-precise-64:~# go build github.com/dgryski/carbonapi
root@vagrant-ubuntu-precise-64:~# go build github.com/dgryski/carbonzipper
root@vagrant-ubuntu-precise-64:~# go build github.com/grobian/carbonserver
root@vagrant-ubuntu-precise-64:~# ls -al ~/go/bin/carbon*
total 53552
drwxr-xr-x 2 root root    4096 Nov 28 16:32 .
drwxr-xr-x 5 root root    4096 Aug  8 13:20 ..
-rwxr-xr-x 1 root root 8796848 Oct 28 16:38 carbonapi
-rwxr-xr-x 1 root root 8526040 Oct 28 16:36 carbonserver
-rwxr-xr-x 1 root root 8515904 Oct 28 16:37 carbonzipper

Copy caronserver binary to graphite backends, and carbonzipper and carbonapi binaries to your frontend. If you do not have separate frontend - just make it - install separate server with graphite-web and install binaries there)

Go to backends first and run servers there - do not forget run it under same user as carbon-caches (e.g. using screen when testing):
~$ ./carbonserver -p=8080 -stdout=true -v=true -vv=true -w="/opt/graphite/storage/whisper"
2014/12/07 16:13:10 starting carbonserver (development build)
2014/12/07 16:13:10 reading whisper files from: /opt/graphite/storage/whisper
2014/12/07 16:13:10 set GOMAXPROCS=12
2014/12/07 16:13:10 listening on :8080

Next, run carbonzipper on the frontend. Create its config file first:
~$ cat zipper.json
 {
    "Backends": [
        "http://10.x.y.z1:8080",
        "http://10.x.y.z2:8080",
        
"http://10.x.y.z3:8080"
    ]
}
I think you got the pattern. J
Then run it in debug mode:
~$ ./carbonzipper -c="./zipper.json" -p=8080 -stdout -d=3
2014/12/07 15:58:44 starting carbonzipper (development version)
2014/12/07 15:58:44 setting GOMAXPROCS= 1
2014/12/07 15:58:44 querying servers= [http://10.x.y.z1:8080 http://10.x.y.z2:8080 http://10.x.y.z3:8080] uri= /metrics/find/?format=protobuf&query=%2A
2014/12/07 15:58:44 listening on :8080

Now you need to patch graphite-web little bit - after putting own IP to CLUSTER_SERVERS is not allowed - and that's exactly what we need to do:

--- a/webapp/graphite/storage.py
+++ b/webapp/graphite/storage.py
@@ -31,7 +31,7 @@
def __init__(self, directories=[], remote_hosts=[]):
self.directories = directories
self.remote_hosts = remote_hosts
- self.remote_stores = [ RemoteStore(host) for host in remote_hosts if not is_local_interface(host) ]
+ self.remote_stores = [ RemoteStore(host) for host in remote_hosts ]

if not (directories or remote_hosts):
raise valueError("directories and remote_hosts cannot both be empty")


Then run your frontend with CLUSTER_SERVERS = ['127.0.0.1:8080'] in local_settings.py.

Everything is prepared; you can test your frontend with normal graphs.
You can check how carbonapi works too, but you need to check which functions were re-implemented in Go in https://github.com/dgryski/carbonapi/blob/master/expr.go first:

~$ ./carbonapi -z="http://localhost:8080" -stdout=true -p=9090 -tz="Europe/Amsterdam,3600"
2014/12/07 16:01:27 starting carbonapi (development build)
2014/12/07 16:01:27 using zipper http://localhost:8080
2014/12/07 16:01:27 using fixed timezone Europe/Amsterdam, offset 3600
2014/12/07 16:01:27 listening on port 9090

That's mostly it.
But I want to mention just one important thing. When I test my graphs with zipper-stack with curl rendering speed was quite good. But when I test my last hour graph generated by zipper-stack instance by my eyes it was looking like this:


Normal one looks like that:

Huh? Do you know what's happened there? I know, unfortunately.
As I mentioned, Graphite is a really good piece of software and use quite good engineering solutions to make thing works with quite a big load on pure Python, not even using C. And most known part of this trick is named carbon-cache. E.g. when you put metrics in graphite usually it doesn't flush to disk instantly but goes to RAM instead using carbon-cache daemon, which keeps it in memory, flushes to disk periodically, and responses results to Graphite web, merging on-disk and in-memory results. 
As you can see on my diagram there're no more lines from carbon zipper to carbon-caches for zipper stack. That's right - carbonserver just reads whisper files from disk and didn't ask carbon-caches! It seems that for booking.com instances disk flushing time for every single metric is below 60 seconds, and for “1-minute retention” whisper files (which they and we are using) after each minute every file is updated and fresh. But our Graphite installation is different - we are using SAN disks and plenty of RAM instead of SSDs, so, for us it took up to 40 minutes to flush metric to disk, that’s why we have that graph depletion on “1-hour” graphs…
So, for us, it's not looks like a viable solution, alas! Or we need to implement carbon-cache interface to carbonserver in Go. But in a moment when I test zipper-stack, we were running an internal version of the hack, which shortly become PR #1010 and it works quite well, for now, so, maybe I return to it later. J
Edit: @grobian is making Go-based write daemon now - https://github.com/grobian/carbonwriter - so, maybe it could be combined with carbonserver to make similar to carbon-cache solution.
But YMMV, of course, just try zipper-stack - it looks very good and promising. 


воскресенье, 23 ноября 2014 г.

Semi-irregular Sysadmin Ninja's Github Digest (Vol. 15)

Hi All,

Let me introduce you Volume 15 of Sysadmin Ninja's Github Digest! (as usual, in no particular order).
But why volume 15, if previous one was 13 and where's 11 and 14 then?
Well, because 11 and 14 are still in my drafts, and although I'm doubt that I'm publish them sometimes... well, let's be at least consistent - I'll try to continue digest publishing (will try to do it) on weekly basis.

1. KeyBox.
A web-based SSH console that executes commands on multiple shells. KeyBox allows you to manage keys, share terminal commands, and upload files to multiple systems simultaneously. http://sshkeybox.com
https://github.com/skavanagh/KeyBox
"A web-based ssh console to execute commands and manage multiple systems simultaneously. KeyBox allows you to share terminal commands and upload files to all your systems. Once the sessions have been opened you can select a single system or any combination to run your commands. Additional system administrators can be added and their terminal sessions and history can be audited. Also, KeyBox can manage and distribute public keys that have been setup and defined."
Can be useful for small distributed team of sysadmins across the globe.

2. FNordmetric
FnordMetric allows you collect and visualize timeseries data with SQL. http://fnordmetric.io
https://github.com/paulasmuth/fnordmetric
Hot stuff. Client-server application which "aims to be a StatsD+graphite competitor, it implements a wire compatible StatsD API". The main idea behind it that you write your query in SQL-like language, called "ChartSQL" and get your graph in SVG format. For it has quite big amount of graphing modes, but almost lacks of any functions for now. Written in C++, so, quite fast, but good luck with porting Graphite function library. Maybe it's a good idea to port Graphite as backend for it. Looks promising anyway.

And talking about Graphite -
3. graphite-stresser
A stress testing tool for Graphite
https://github.com/feangulo/graphite-stresser
Nothing unusual, but nice tool if you want to stress test your Graphite instance. Check author blog's entry for details.

4. pstop
pstop - a top-like program for MySQL
https://github.com/sjmudd/pstop
"pstop is a program which collects information from MySQL 5.6+'s performance_schema database and uses this information to display server load in real-time." For example, you can get IOPS for innodb file, or locks / operations / latencies per table. At least, you can start using performance schema in your MySQL 5.6 instance for something useful. Another useful P_S tool is "sys schema", you can read recent entry in Percona blog about it.

5. Consul-template
Generic template rendering and notifications with Consul
https://github.com/hashicorp/consul-template
Quite recent addition to service discovery tool Consul.io - now you can use it for any service which didn't understand service discovery through DNS - you can format config file templates for that service and reload it when Consul will see configuration change. Agian, blog post is better than 1000 words.

6. VCLfiddle
VclFiddle is hosted at http://www.vclfiddle.net/
https://github.com/vclfiddle/vclfiddle

"VclFiddle is an online tool for experimenting with the Varnish Cache HTTP reverse-proxy in a sandboxed environment. The name comes from a combination of the Varnish Configuration Language (VCL) and another tool that inspired this project, JSFiddle."
I.e. you can edit your VCL config on-line, using web editor, and check how it caches your website.

7. Racher.io
Rancher is an open source project that provides infrastructure services designed specifically for Docker. http://www.rancher.io
https://github.com/rancherio/rancher
Quite ambitious project for creating AWS-like environment, but for Docker containers. 

8. Atlas
A high-performance and stable proxy for MySQL
https://github.com/Qihoo360/Atlas
Another MySQL proxy. Well... Personally I never saw any production running on some MySQL-proxy solution (even on MySQL Fabric), but some China company named Qihoo360 developed this solution and insists that it's running on their production infrastructure.

9. Bosun
An advanced, open-source monitoring and alerting system by Stack Exchange http://bosun.io
https://github.com/bosun-monitor/bosun
Another Graphite competitior - OpenTSDB-backed service with own system metric's collector scollector and graphing and alerting interface. Written in Go. Looks neat and scalable:


And speaking about Go -
10. Go-opstocat
Collection of Ops related patterns for Go apps at GitHub.
https://github.com/github/go-opstocat
and
11. Delve
Delve is a Go debugger, written in Go.
https://github.com/derekparker/delve

Going further.
12. bup
Very efficient backup system based on the git packfile format, providing fast incremental saves and global deduplication (among and within files, including virtual machine images).
https://bup.github.io/

https://github.com/bup/bup
Interesting new backup tool, quite green and fresh, but looks promising.

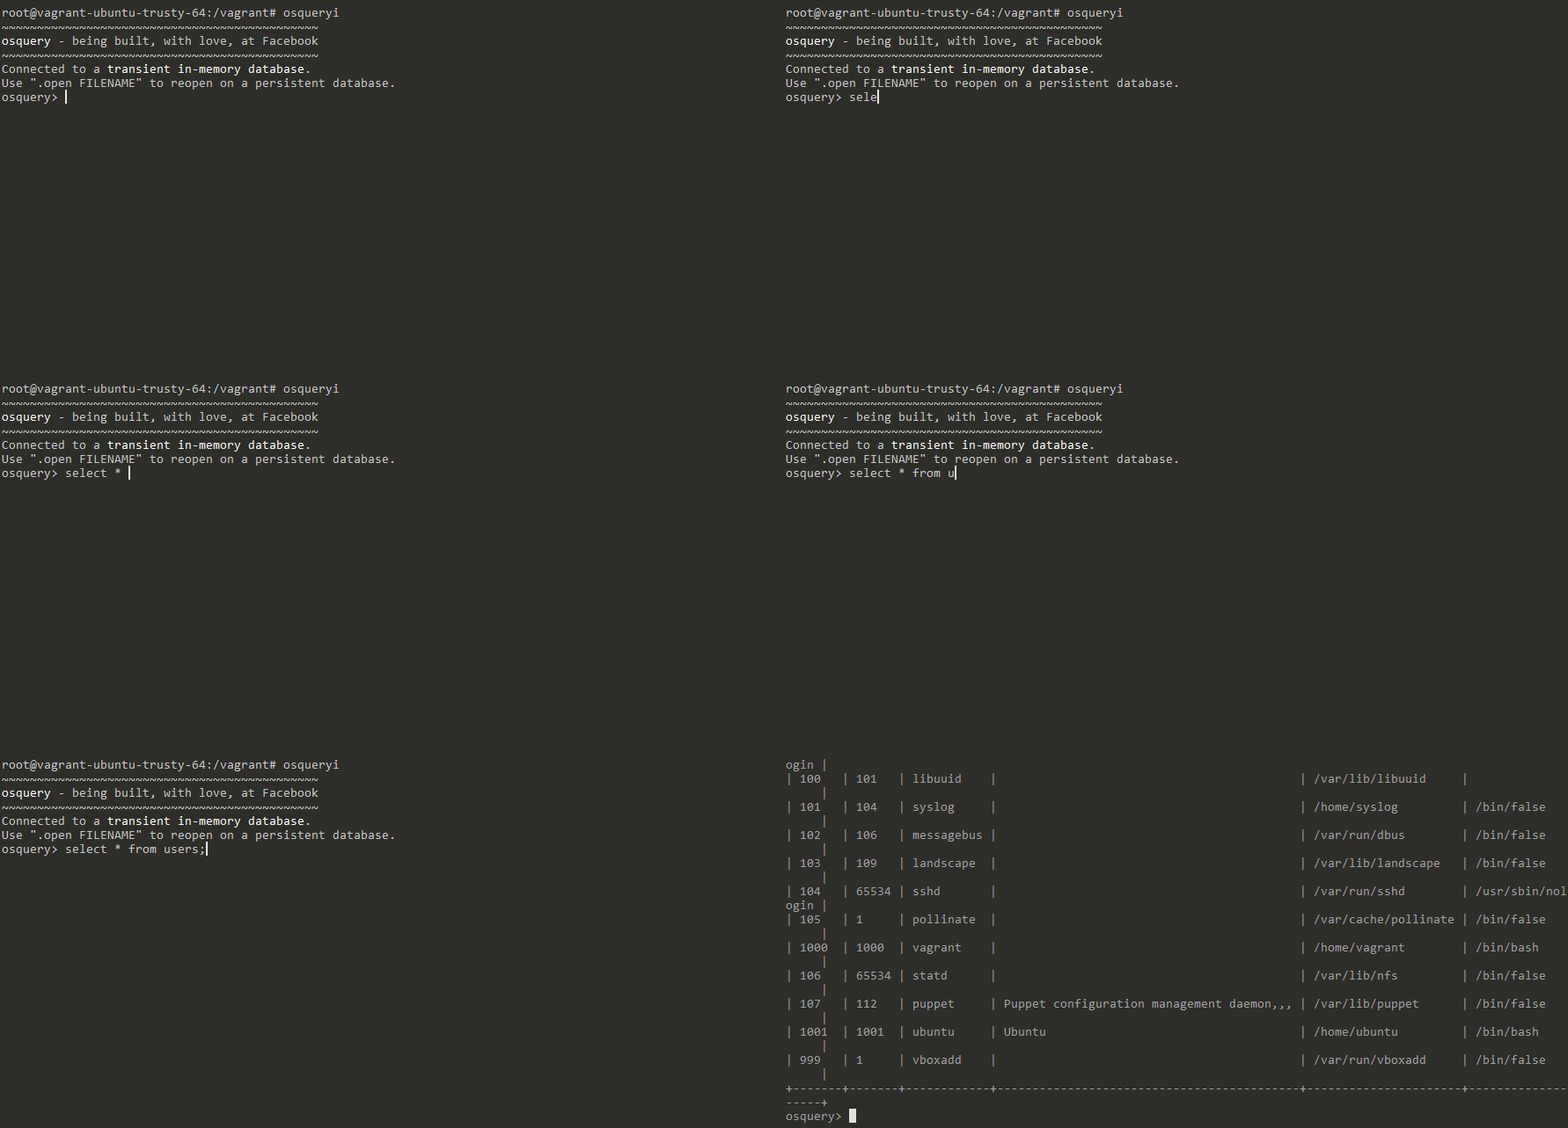
13. osquery
SQL powered operating system instrumentation, monitoring, and analytics.
http://osquery.io

https://github.com/facebook/osquery
Facebook quite recently open-sourced that tool. Idea is looks very promising - again present system state as SQL tables on which you can run queries, by interactive console or automatically, as daemon.


And fun section
15. C4
C in four functions
https://github.com/rswier/c4
C-compile in 500 lines of C. Reading of it's sources is quite fun. :)

16. Gravity
An orbital simulation game written in Elm
https://github.com/stephenbalaban/Gravity
You can play it here.

17. Convergence
Python/OpenCl Cellular Automata design & manipulation tool
https://github.com/InfiniteSearchSpace/PyCl-Convergence
Looks like fun, but can't run that on my Mac for some reason, so, no screenshots.

понедельник, 21 июля 2014 г.

Ops Github Digest #7 (July 21st 2014)

Hello Everybody!

Summer is going on, it's too hot for thinking much about work and stuff, everybody is want to go to vacation, right?
Right, but for everyone else trapped in stifling offices - next issue of Ops Github Digest!

1. Anode - Utility for analyzing graphite metrics. 
Experimental package.
Anode is a tool for experimenting with different analysis algorithms on metrics and other time series.
You have your data from Graphite, but don't know what to do with it? Try to experiment with that tool to find out:


WARNING! DANGER AHEAD! 
Some math required. :)
Please check that link for explanation how it works.


2. More awesomeness!
We have another list of awesome lists - https://github.com/sindresorhus/awesome, awesome algorithms - https://github.com/tayllan/awesome-algorithms, awesome machine learning - https://github.com/josephmisiti/awesome-machine-learning, and awesome bigdata - https://github.com/onurakpolat/awesome-bigdata
But my favorite - list of awesome T-Shirt sites - https://github.com/elder-cb/teesites !

3. Log file navigator http://lnav.org
https://github.com/tstack/lnav

Nice log reading / colorizing tool, especially for own server.


4. Another PuppetDB frontend:
Spotify's Puppetexplorer https://github.com/spotify/puppetexplorer

Has own query language and able to combine data from different PuppetDBs into one.

5. Facette
Time series data visualization and graphing software http://facette.io/
https://github.com/facette/facette

Facette is a web application to display time series data from various sources — such as collectd or Graphite — on graphs, designed to be easy to setup and to use.


6. storm is a command line tool to manage your ssh connections. 
https://github.com/emre/storm/

7. maestro-ng - Orchestration of Docker-based, multi-host environmentshttps://github.com/signalfuse/maestro-ng
Quite self-explanatory, please check if you use Docker.

8. miniLock - miniLock is a small, portable file encryption software.
https://github.com/kaepora/miniLock

New generation of modern file encryption software, which tries to proof that JS-crypto suck less nowadays.
9. And now - for you, my fellow esoteric programming language freaks!


Escher: A language for programming in metaphors 
Truly mind blowing if you have enough patience to wrap your mind around it. :)

среда, 2 июля 2014 г.

Sporadic Ops GitHub digest #3 (02 Jul 2014)

We are still rollin'. Go!

1. Tessera.
A dashboard front-end for graphite 
https://github.com/urbanairship/tessera
Good and promising Graphite dashboard.

2. BitAuth
Authenticate with web services utilizing the same strategy as Bitcoin.
https://github.com/bitpay/bitauth

Proposal for a new passwordless authentication protocol which is not storing user passwords at all. :)
See their blog for details.

3. cheap secrets
Store your passwords in git
https://github.com/bpo/cheap-secrets

Personal password storage in Git, nice. PGP encrypted, of course.

4. doitlive
doitlive is a tool for live presentations in the terminal. It reads a file of shell commands and replays the commands in a fake terminal session as you type random characters.
https://github.com/sloria/doitlive

If you need to do presentations of your terminal sessions.

5. Ambassadord - A Docker ambassador (containerized TCP reverse proxy / forwarder) that supports static forwards, DNS-based forwards (with SRV), Consul+Etcd based forwards, or forwards based on the connecting container's intended backend (read: magic).
https://github.com/progrium/ambassadord

Too much to explain. :) Read about Docker first.